
Model Investment Portfolios |
| Site Information (is listed below. The financial planning software modules for sale are on the right-side column) Confused? It Makes More Sense if You Start at the Home Page How to Buy Investment Software New Financial Planner Starter Kit Professional Investment Portfolio Building Kit Financial Planning Software Support Financial Planner Software Updates Site Information, Ordering Security, Privacy, FAQs Questions about Personal Finance Software? Call (707) 996-9664 or Send E-mail to support@toolsformoney.com Free Downloads and Money Tools Free Sample Comprehensive Financial Plans Free Money Software Downloads, Tutorials, Primers, Freebies, Investing Tips, and Other Resources List of Free Financial Planning Software Demos Selected Links to Other Relevant Money Websites
|
Prices and ordering information are at the bottom
This is a do-It-yourself money management system. It was the first DIY Model-based investing system to become available in 2001. Most everyone else has since copied it, but still none have the performance - especially when markets are down. We're still the only vendor with a viable fixed annuity alternative (AKA the Conservative High Income Models), and Models that use both mutual funds and ETFs (AKA the Hybrid Models). It's also a complete turnkey investment portfolio building system for financial advisors. What a turnkey system means is that all you'll have to do is insert the key (buy it), and then turn the crank (read the directions), and the machine spits out the finished product all ready to use in the Real World (actual investment portfolios). You can hire us to manage your money according to any of our Models and/or Asset Allocation Software. So we'll do all of the rebalancing, fund switches, and all the usual maintenance for a flat $250 a month fee. Retired investors, please consider the CHIM below before you get get stuck for life in a fixed annuity. What Investing Models Are: Model allocations are a very old investment strategy - probably even "the oldest trick in the book." You may know it as: Managing Managers, Composites, Composite Portfolios, Asset Allocation Funds, or Fund of Funds (FoF). Other variations are in the text below. They're all the same thing, regardless of how the words are mixed up.
Model is the name given to something that represents a facsimile of the real thing. For example, a model airplane is designed to look like the real aircraft. In this case, investment portfolios that actual investors own in the Real World look and act like the master investment portfolio models. So if there's $1B of assets in a master model, and you own $100,000 of it, then you'd have something small that looked, and acted, just like the real thing. This way you're able to get similar results of the whole pie, just by owning a slice. The results will never be exactly the same, just similar. The only way an investor would own an exact investing model is if they initially bought all of the investment vehicles in the exact amounts, on the first trading day, the trades all settled the same day, all distributions were reinvested, they never made another trade other than the quarterly rebalancing and investment switches that occurred in the master model (and all of these trades settled on the same day), never put new money in, never paid taxes on it, and never redeemed shares. None of that ever happens, so model investment portfolios are never the real thing. The actual results will be close, and sometimes even better, but never exactly the same as the master Model Portfolios. Even though they are not real, model investment portfolios are very popular and helpful to get the point across. For financial advisers, they're the oldest and most-commonly-used standardized method of showing what actual investment portfolios would look like in terms of funding vehicles, risk, asset class mix, income yields, and what the historical performance has been. If a pre-existing investment portfolio (a set mix of asset classes funded with specific investment vehicles) exists before one invests in it, then it's a Model Portfolio. If a unique personalized investment portfolio is created, but did not exist beforehand, then it's not a Model Portfolio. This image best sums up this investment strategy
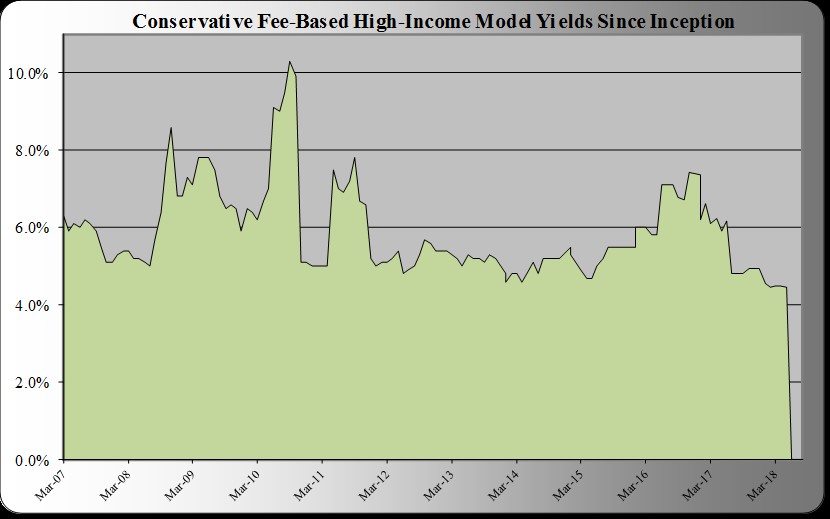
There Are 13 Versions of the Regular Portfolio Models There are a total of 70 model allocations; because fourteen have five investment risk tolerance categories (Conservative, Moderately Conservative, Moderate, Moderately Aggressive, and Aggressive). Then there's three Conservative High-income Models and one Retirement Target Date Model, and one Market Timing Model. Then the Dynamic Target Date Models information is here. Plus, here's the investment calculator for modeling market timing strategies (this doesn't count as an investor model, but it uses the model allocations to backtest timing strategies). The regular, static, passively-managed, investment models are: • Five Hybrid Models using both mutual funds and ETFs. All returns are benchmarked from these, and not the Fee-Based Models starting in Jan '17. • Five ETF (Exchange Traded Funds) Models for both investors managing their own money, and Fee-Based advisers that like ETFs. • Five Fee-Based Models are for investment advisors working on an investment management fee basis (AKA an RIA using a Fee-Based custodian platform). Here mutual funds with front-end loads are bought at NAV (Net Asset Value, or in English, the initial sales charges on A-shares are waived so the investor doesn't pay them). • Five all No-load Mutual Fund Models for DIY investors managing their own money, or investment advisors working on a fee-only basis (without access to A-share mutual funds at NAV). • Five Benchmark Index Models. These are used for comparing passive investment management with active investment management (because they also serve as benchmark portfolios constructed specifically for this purpose). The same asset classes and allocation weights as the other normal portfolio models with 17 asset classes are used, but they are funded with benchmark indices. They cannot be invested in like all of the other Model Portfolios, and so they just serve as a point of reference for comparison purposes (so model performance can be compared apples-to-apples after linking returns). • Five all Front-end Loaded Mutual Fund Models for investment advisers working on a commission basis. _____________________ All of the Model Portfolios above have their returns linked to account for switches, rebalancings, fees, asset class weight changes, etc. So all returns since Jan '99 or Jan '17 are actual, whereas all of the returns of the Models below are hypothetical (because they just show past returns using current funding vehicles, which changed in the past). The Benchmark Index Models have actual returns without needing a spreadsheet to calculate them, because there are no fees or switches (but they are not rebalanced nor adjusted for past weight changes). Why? Because nobody does that, like they're supposed to. When everyone is doing that, then we'll do that too. _____________________ • Five Index Fund Models for both investors managing their own money and fee-only professionals that like to use index funds. These have two less asset classes than the regular portfolio models because there are no index funds for them yet (15 total). All of the index mutual fund picks are no-load, under $5,000 minimum initial investment, and there are no Load-waived funds, so any investor can buy them. So this is the asset allocation mix solution if you don't want to keep up with someone else's mutual fund picks and changes. Just index and rebalance. Because of yet another Morningstar failure, and lack of interest that hasn't been there for over a decade (since ETFs came out), Index Funds are not screened and Index Fund Models are not maintained anymore. They're still there, but unless you say you want it refreshed, it's not updated anymore. • Two sets of investing models for $60,000 minimum accounts (ten models total). The same five-investment risk tolerance categories use only 13 asset classes here. This allows you to get the benefits of this passive investment management strategy, with only $60,000 worth of either no-load or front-end load mutual funds. • Two sets of investor models for $20,000 minimum accounts. They have the same five-investment risk tolerances and use eight asset classes. This allows you to get the benefits of this static investing management strategy with only $20,000 worth of either no-load or front-end load mutual funds. • Five asset allocator models made from the no-load variable annuity discussed on this page. Their 357 subaccounts were optimized down to fifteen asset classes. Now Fee-Based advisers can get their clients to exchange their VAs into this, and then charge them AUM fees for managing it. • Five allocation models made from only American Funds. We optimized their 22 mutual funds down to nine asset classes. The CHIMs use normal mutual funds and ETFs, so there is nothing "guaranteed" nor "insured" about them whatsoever. Also, because they have such a high allocation of fixed income, their principle value will go down more than the other investing Models when interest rates go up - even though allocations are more conservative than the regular Conservative Models. Read why you shouldn't fear fixed income mutual funds, or ETFs, when interest rates increase. If you have enough money in it, then you can set it up so it completely eliminates account draw-downs. This is because the total account value would only go down when the markets go down or interest rates go up. The point of the CHIMs are to make it so you'll realize maximum income distributions to spend. This makes it so you don't have to sell shares. So if you don't sell shares, and the markets don't go down, then there are no draw-downs at all - just the opposite most of the time (in "normal times" - when bonds actually yield something - like they will in a few years or so if interest rates keep going back up to normal pre-meltdown levels). So the CHIMs are sort of the "magic solution" to most all mundane concerns like this. The CHIMs are for retired, or soon to be retired investors, that just want to set everything up on autopilot and then ignore the outside world. Because you don't sell shares, this makes all forms of fear-based news irrelevant and easier to ignore, while getting a relatively safe yield in the 6% range (and slowly growing as interest rates go back up). So regardless of how scary the world is, you just do nothing but make the monthly fund switches (if any), and just let it do its thing (putting interest, dividend, and capital gains distributions into your checking account for you to spend). The CHIM helps make it so you can do mostly nothing, and get a big fat safe yield to spend. So this is the opposite of what investors want if they're prone to overreactions that makes them sell equity shares every time the news wants to scare them (into buying gold). There's a Fee-Based CHIM and then the same thing was duplicated using all no-load, and all loaded mutual funds. ETFs were looked at too, but none had better yields than mutual funds, so project abandoned. All of the text below is only for the Fee-Based Conservative High-Income Model. Yield is the combined distributions of an investment and is part of total return. For a mutual fund, it's the combined dividends the fund takes (realizes). These are the taxable events, which if you choose not to reinvest, end up in your cash (sweep, or money market) account. Mutual fund yields are calculated like this: Annual Yield = Dividends / (NAV + Capital Gains Distributions) The last 12-months Fee-Based CHIM's income yield was 6.7% and the total return was 20.0%. These are hypothetical because they don't account for past fund switches, rebalancings, or allocation changes. This investing model is very different than the regular models because its goal is to maximize income yield, not beat any benchmark index. So the history of returns have are not maintained. You can see the YTD and last three year returns on the investing model demo. Here's an estimate of how these numbers work out: If you'd invested $100 one-year ago at the beginning of last month, and the total return was 20% and the yield was 6.7%, then now you'd have ~$6.70 in cash to spend (in your money market / cash / sweep account), and in addition to that, the fund would still be worth ~$113.30 (because no shares needed to be sold to get the income yield). This means you could sell all or any amount of the ~$113.30 at any time for any reason. This is something you CANNOT do with CDs, real estate, annuitized annuities, limited partnerships, large individual bonds, private stock and options, gold, etc. Investors are also loathe to sell stocks and mutual funds when they're down, so you usually "cannot do that" either. So right off the bat, the CHIM's high liquidity may literally save your life (if you really really need your money). Then the number of mutual fund shares you owned would always be the same, and so you'd have ~$6.70 of income to report on your taxes (assuming the mutual funds were not in a Roth IRA). How much in taxes would vary as the composition of dividends, capital gains, and interest income would be random based on what the funds actually distributed. This may not look like much, but on average it's twice the yield on all of our other investing models (and even more compared to what most everyone else is getting). This is because it's another unique invention from T4$, so nobody else has this. It takes five to ten years for investors to catch on and start copying our work. For example, all Robo-adviser sites are basically offering the exact same things as our Models (so it took them from '98 to '14 to copy and automate our Models (they wanted to do it much sooner, but the technology wasn't available yet). Some were even our customers that tried to get us to join their Robo adventures around 2012. The only difference is that Robos charge rock-bottom prices for their cookie-cutting one-size-fits-all non-personalized services running on insecure cloud servers. Whereas with ours, it's 100% secure mostly all custom work (where the investor can have input on how their money is invested). So if you look at the yields of everyone else's Models, including the Robos, then you'll see that cloud-based automation still has years to go before it catches up with live money managers. And if they do copy the CHIM, then we'll sue big time for copyright infringement. So the bottom line between our seminal Investment Models, and copycat Robo Models, are the returns and the fees. Keep checking the returns on these pages, because this is one area where fintech won't win (because our returns will most always be better, even after our 1% annual AUM fees for live clients with live accounts with our CA RIA). Regardless of how fintech progresses, one can never escape the mundane State of Humanity - "There ain't no free lunch, and in one way or another, you get what you pay for!" There's more about Robos below the table of returns. The most important thing is this (if you set it up and manage it correctly): The number of mutual fund shares you owned will most always be the same after you get paid your retirement income paycheck, as it was before you got paid! Good luck trying to find something that performs this function, with these returns and low risk, for this price! Then in Jan '17, the SEC started saying they're going to put more resources into regulating Robos too. So the free lunch may be coming to an end sooner than you think. what this will do For example, the yield on the optimized Conservative American Funds Model was only ~1.4% and the last 12-months return was ~1.6% (and this does not account for the sales loads). So if you had a million bucks in the Conservative American Funds Model, your monthly retirement paycheck, from just yield, would only be ~$1,000. With the Fee-Based CHIM, it would have been ~$6,167. So this resulted in having ~517% more retirement paycheck compared to investing the obsolete 80's "American way." So in order to receive the same amount of retirement check with American Funds, you'd have to constantly sell shares. This will probably make your nest egg run out before you pass away. With the CHIM, you probably wouldn't need to sell shares to get a decent yield and retirement paycheck; so when you pass away, there's a better chance that you'd still have around your original million bucks intact. Even worse, if you gave your million dollar nest egg to a life insurance company in exchange for the usual plain vanilla fixed annuity, not only would you probably realize even less retirement income than with American Funds (~10% less), it wouldn't even keep up with cost of living inflation at all (unless you paid the insurance premiums for an inflation rider, then you'd get about 15% less paycheck than by using American Funds). Then when you pass away, your heirs would receive nada bupkiss el zilcho (unless you paid the insurance premium to provide a death benefit, then you'd get about 15% less paycheck than with American Funds). So if you combine the cost of these two needed insurance contracts to insure for these two huge risks, which are 100% certain to happen, you're making around 20% to 25% less spendable income in a fixed annuity than with American Funds. So this adds up to be around 70% to 80% less retirement income paycheck than the CHIM would probably provide over your retirement years. This is why all of this boring stuff matters and why you need to wake up and pay attention ASAP to what's really going on in life, and not just what a salesperson is feeding just you to get their huge immediate commissions. One also must factor in risk and total return when considering how high or low yield is. This model's income is extremely high considering the low risk (because of the extreme diversification and low equity exposure) and relatively high total return. Taking that into account, this compromise between high yield, low-risk, and high total return is better than anything else we've ever seen (if someone has a better investment strategy to get higher yields with less risk, then we'd be doing that too). These yields were a lot higher in 2010, but after banning fund families that abuse leverage and derivatives, play shenanigans and other tricks that make the fixed-income parts of the portfolio not be conservative (e.g., PIMCO), it's down. The bright side of that is that the yields are much more stable, the funds are a lot more conservative, shenanigans by the funds are mostly eliminated, and thus are more suitable for retired investors. This is as good as it gets, and is ideal for investors that don't want to sell shares to raise money to spend on living expenses. If you do your research, you'll see it's extremely difficult to get this rate of income without selling anything; all while realizing low-risk, good returns, and the other advantages of using only open-ended mutual funds (low costs, extreme diversification, liquidity, transparency, etc.). If you're retired and need money from an investment portfolio to live off of, then this may help make it last a lot longer. This is because the more income distributions a portfolio sheds without selling shares, the fewer shares you'll need to sell to get the paycheck you need, and the fewer shares you sell, the more money you're going to have later. Also the more conservatively a portfolio is constructed, the longer it will last too, especially when the markets are down. Once you sell shares, they do not just magically grow back (if you're spending all of the distributions instead of reinvesting them, which is what you'll do with this Model Portfolio). In other words, if you spend the income, the only way to have more shares is to invest more money. Capital gains taxes are also kept to a minimum when you don't redeem shares for income. There's no profits to report if you don't sell and realize any gains. You'll be realizing and spending the internal realized capital gains distributions though. So two of the main tricks to not run out of money when you reach an advanced age is to not sell shares, and never invest in any form of "self-destructing bonds" or these types of bond ETFs or mutual funds, as explained in the free Money eBook. While on the subject, here's the way we like to think about the value of paying an advisor to construct an investment portfolio for the purpose of producing a sustainable retirement paycheck: Take the total amount of their fees, expenses, and commissions and divide that by the amount of income realized over the past year (don't count share sales as income, just dividends and capital gains distributions). If it's more than 20%, then you'd probably do a better job of managing your money yourself using our CHIM, you'd probably get a higher yield with a higher overall rate of return with less risk, you'd end up selling many less shares, worrying about trust, ethics, security, and privacy issues would be history, and you'd save all of their fees and commissions - forever! For example, if you have a $1M portfolio, pay 1% in fees, and are getting 5% income (without selling shares), then you're paying 20% of your income in fees. More than 20% and we think you'd be better off doing it yourself, and not paying any of their fees anymore. More than likely, you've only been getting ~3% income yield, and they've been selling shares, so this would yield 40% of your income going to pay the advisor. This is way too high, so DIY! Also, the CHIM is just about the only "thing" you can just buy, read the directions, and use; that will help you set up and manage tiny endowment-like funds. As long as your average spending yield is lower than the CHIM's average yield, then that will perform this function - without having to hire actuaries or a team of expensive investment advisors that specialize in endowment fund investing. In other words, the CHIM is the money tool that does this job as close as you can get without spending "real money" on the project. Download this Word docx that explains why all of this is so critical these days Also, while on the subject: Why fixed annuities are NOT the answer when it comes to getting a retirement paycheck from your nest egg (and why you shouldn't fear buying bond mutual funds when you think interest rates are about to go up). There's more math and evidence that this is the best way to get retirement income on the fixed annuity page (click the link above)
The Asset Allocation Models Include: • All of the 65 model allocations described above. • The mutual fund picks spreadsheet for all 22 asset classes. These portfolio models only use 17 asset classes (the other five asset classes are for use with the comprehensive asset allocator software). There's 22 mutual fund recommendations, times five ways of managing money, totaling over 100 monthly-updated investment recommendations. To keep everything updated and balanced, you can also subscribe to keep these models and/or just the mutual fund recommendations fresh on a monthly basis. You'll receive the reasons for all switches to decide whether or not to sell the old mutual fund and buy the new one. • Sometimes, there's a short "investment newsletter" for subscribers explaining what happened over the last month regarding the models, mutual fund selections, generic site information, and sometimes market commentary. • A sheet for inputting a comparison portfolio. This has two purposes: First, it allows for quick and easy rebalancing of actual portfolios, compared with one of the models of your choice. This shows how much the actual allocation mix is off by, both in percentage and dollar amounts. This tells you exactly how much to buy or sell in each asset class (with tickers) to bring the portfolio back into balance. Then you can compare the asset allocations, the returns, and the differences in returns, between the model allocations and the actual portfolio held. There is also a matrix of these returns, and the differences between the actual investment portfolio. It also displays past portfolio returns, and the asset allocation mix of the comparison / actual portfolio. Some of this can be seen on the demo. • Over 50 charts graphically show all of the asset allocations, and the actual / comparison Model Portfolio. • Five html files that may help you use model asset allocations with 401k plans. Once you buy the models, or have the free Money eBook, you'll also get step-by-step directions on how to better allocate a 401(k) plan by yourself. • Three spreadsheets showing the linked returns and mutual fund switches since inception for the Fee-Based (since 1/99), and the No-Load and Load Models (since 1/03). Linking returns uses the "Time Weighted" methodology, and is the standard used in accounting for past trades when calculating historical investment performance. You can use all three of these spreadsheets to audit the returns yourself. About this, and how the returns are calculated, are in the directions. Other Information • If you use a third-party money manager, and they charge 50bps, then for every million you have with them, you're giving up $5,000 a year of gross income. Our investing system allows you to keep all of your money, while most likely realizing better returns with less risk. • The most valuable feature, is that this system allows you to create investment portfolios that are ready to be implemented in the Real World. This is called a turnkey system. What this means is that all you have to do is insert the key (buy it), then turn the crank (read the directions), and the machine spits out the finished product all ready to use in the Real World (your portfolio). We use Morningstar for their mutual fund database to pick the mutual funds every month, and that's all (it costs ~$2,400 a year and they raise their prices ~15% every year). Our investing software gives you both a great investment strategy, and the funding vehicle recommendations, but doesn't have this vast database needed to evaluate strategies nor the investment vehicles used. So advisors may need both if they want to use our models as a framework to create other models. But if you don't want to do that, or if you're a DIY investor, then you won't even need Morningstar if you have our system, because everything is already done for you. So this turnkey money management system makes it so you won't need to buy or use any other investment software. • All mutual fund asset allocations display their last 12-months income yield, except the benchmark index allocation models, which don't have yields. • The portfolio models, mutual fund selections, and all of the portfolio returns are updated and sent out to subscribers around two days after the first trading day of each month. Yes, this used to be mid-month, but we had to migrate to Morningstar's AWS, so the big advantage there is being able to update on the first trading day of the month now. • Advisers can input their own fees and trading cost numbers into the Fee-Based Model's Linked Returns spreadsheet to see how the returns change. • These same asset allocation model concepts can also be used with variable annuities, variable life insurance (VUL), 401k / 457 / 403bs, 529 plans, and with just one mutual fund family like we do for American Funds (or using as many fund families as you want). • Most investment managers' models do not account for past trades, so the actual returns investors' realize are usually 10% to 30% less than what's advertised via their hypothetical returns. The only way to see how well a strategy is really doing is to run the actual numbers. You can see these differences using our Aggressive Fee-Based Model on the chart of comparison returns on the main asset allocation primer page. This is explained in detail in the directions. Using the Table of Historical Investment Model Returns First, the Fee-Based Models are old news and the Hybrid Models are the latest and greatest thing. Starting January '17, everything is being benched from the Hybrid models. So if you're a money manager, don't use and ignore the returns of the Fee-Based Models. The only reason for using the Fee-Based Models going forward, is if you're a financial adviser, and for whatever reason, you don't want to use ETFs. Investors should use the either the Hybrid Models, ETF Models, or the No-Load Models (in that order - if you want what Investing Models do - which is give you extreme diversification to minimize risks). Next, if you're comparing performance to another not-T4$ Model, then you should know that the chances that their returns have been linked to account for past investment vehicle changes, rebalancings, and asset class weight changes are slim to none, and Slim left town. So once you're sure they have just been using past returns from their current hot picks, instead of properly accounting for for their losing picks along the way, then do not use returns below that are linked. Use the hypo returns below that have not been linked. This way, you are comparing apples-to-apples, and not something that looks good because it's fake, compared to something that is real. If there's returns on our site for only than three years, then they are not linked. Other than the Hybrid Models, only sets of returns showing five years or more have been linked. We know that 99.9% of all money manager's returns have not been linked, because we tried to offer that as a service to advisers. It's a lot of work, so it's a lot of money, so nobody ever did that. Ones we've talked with in person had zero stomach for paying over $1,000 to shine the spotlight of truth onto their work - even if it looked like they've been outperforming their competition. If so, then that $1,000 paid to us to do the work would have been returned to them many times over, because they can use that to easily take accounts away from their competition. So it's yet another example of financial advisors being "penny wise and pound foolish." So the bottom line is that is very rare that any return you see from a diversified investment portfolio of any kind is actual. So the standard language used to describe portfolio returns that are not linked, is hypothetical. The point is that hypo returns can be several times greater than actual returns, as you can see by comparing both from the same Portfolio Models below. So the bottom line is to only compared hypo to hypo, and actual to actual. Since only ~0.1% of money managers maintain actual returns, you'll be comparing hypo to hypo most all of the time. The table below shows the actual returns for the Fee-Based Model Portfolios. They are "actual" and not "hypothetical" as shown in the demo. These are the actual returns from inception (1 January 1999) showing the returns as if you initially bought all of the investment vehicles in the exact amounts, on the first trading day, the trades all magically settled the same day, all distributions were reinvested, you never made another trade other than the monthly rebalancing and investment switches that occurred in the master model (and all of these trades settled on the same day), never put new money in, never paid taxes on it, and never redeemed shares. Compare these results to what you, or your advisors, have been getting. They are probably much better. Why? Because buy-and-hold passive asset allocation strategies work better than stock or ETF picking or market timing. When you think about it, that's all there is to do, there is nothing else other than speculating with derivatives or buying life insurance company products. All of this is just that simple. Read a summary, or go here or here or here or here for more details. The great debate that's been going on since the beginning of time is finally over: Can active investment management ever consistently profit more than passive management, after expenses? These investing models are proof that active management works, and the cost is so low that it's almost insignificant. As long as you don't try to pick stocks / ETFs and/or time Markets with the investing models, and use mutual funds that even slightly outperform their asset classes, you can sometimes beat the markets while being extremely diversified. But not always - nowadays ETFs are the tail that wag the market dog, so nobody is "beating the markets anymore" The returns shown below are also NOT due to luck. They are very consistent over the time we've been tracking them (1995, but the history of trades was not recorded until '98). There have been only a couple dozen months (out of 217) when the Moderate Index Model beat the Fee-Based Moderate or Aggressive Model. If these returns were due to luck, then it would have been around half of the time. You can see the current hypothetical numbers compared to the Index Model by looking at the demo's charts. Also the actual performance for the Fee-Based Moderate or Aggressive Model compared to the Index Model is on the table of historical investing returns here. On the demo screen print, you can also see all of the current relevant portfolio statistics, like alpha, beta, standard deviation, etc. (these came from the asset allocation software, and are not part of the investing models). See a table of asset class returns on the mutual fund picks page that show how and why correlation coefficients of asset allocation work so well (all of this is AKA Modern Portfolio Theory, or MPT). The most Real World thing to do when looking at the table below, is to compare the Moderate or Aggressive Model (or the Fee-Based Moderate Model Portfolio when markets are down) with the S&P 500 over the various time frames. The longer the time frame, the more meaningful the comparisons are. The returns are after all mutual fund fees and expenses (e.g., 12b-1s) are taken into account. But they don't account for annual management fees that a professional investment advisor would charge a client. This is because those are estimated and accounted for on the three links here: See the table of returns assuming you charge your clients 0.5% annual management fees (low) See the table of returns assuming you charge your clients 1.0% annual management fees (average) See the table of returns assuming you charge your clients 1.5% annual management fees (high) See the table of returns for the No-Load Mutual Fund Models See the table of returns for the All-Loaded Mutual Fund Models To download the demo, right click on the link below, and then choose "Save (Target) As..." to save to your hard drive. Then find it and open with Word. Download the Model Portfolio "demo" - a large Word docx, which has charts showing historical returns for all of the investing models. This is the best place to view the differences in returns between the ETF, No-Load, and Fee-Based Models Download text for financial advisers that explains the Model Portfolios to investment management clients. |
Financial Planning Software Modules For Sale (are listed below) Financial Planning Software that's Fully-Integrated Goals-Only "Financial Planning Software" Retirement Planning Software Menu: Something for Everyone Comprehensive Asset Allocation Software Monthly-updated ETF and Mutual Fund Picks DIY Investment Portfolio Benchmarking Program Financial Planning Fact Finders for Financial Planners Gathering Data from Clients Investment Policy Statement Software (IPS) Life Insurance Calculator (AKA Capital Needs Analysis Software) Bond Calculators for Duration, Convexity, YTM, Accretion, and Amortization Investment Software for Comparing the 27 Most Popular Methods of Investing Rental Real Estate Investing Software Net Worth Calculator (Balance Sheet Maker) and 75-year Net Worth Projector Financial Seminar Covering Retirement Planning and Investment Management Sales Tools for Financial Adviser Marketing Personal Budget Software and 75-year Cash Flow Projector TVM Financial Tools and Financial Calculators Our Unique Financial Services Buy or Sell a Financial Planning Practice Miscellaneous Pages of Interest Primer Tutorial to Learn the Basics of Financial Planning Software About the Department of Labor's New Fiduciary Rules Using Asset Allocation to Manage Money Download Brokerage Data into Spreadsheets How to Integrate Financial Planning Software Modules to Share Data CRM and Portfolio Management Software About Efficient Frontier Portfolio Optimizers Calculating Your Investment Risk Tolerance |

| Time Frames | Conservative Model | Moderately Conservative Model | Moderate Model | Moderately Aggressive Model | Aggressive Model | DJIA | S&P 500 | NASDAQ | Russell 2000 | MSCI EAFE | Barclays & S&P US Aggregate Bond |
| 1999 | 25.91% | 37.27% | 48.72% | 64.64% | 85.40% | 25.22% | 19.53% | 85.59% | 21.26% | 27.30% | -0.83% |
| 2000 | 3.88% | -2.15% | -8.02% | -9.89% | -12.16% | -6.18% | -10.14% | -39.29% | -3.02% | -13.96% | 11.63% |
| 2001 | -0.16% | -3.03% | -3.86% | -5.28% | -6.25% | -7.10% | -13.04% | -21.05% | 2.49% | -21.21% | 8.42% |
| 2002 | -0.04% | -5.99% | -12.68% | -18.65% | -23.56% | -16.76% | -23.37% | -31.53% | -21.58% | -17.52% | 10.27% |
| 2003 | 21.87% | 30.22% | 35.93% | 39.49% | 39.69% | 28.28% | 28.68% | 29.28% | 47.25% | 17.41% | 4.11% |
| 2004 | 11.57% | 13.59% | 14.77% | 15.34% | 15.12% | 5.32% | 10.87% | 8.59% | 18.33% | 10.18% | 4.34% |
| 2005 | 9.84% | 11.62% | 13.08% | 14.17% | 13.80% | 1.72% | 4.91% | 1.37% | 4.55% | 25.96% | 2.43% |
| 2006 | 10.89% | 12.91% | 14.80% | 15.81% | 15.99% | 19.05% | 15.79% | 9.52% | 18.37% | 13.81% | 4.33% |
| 2007 | 13.45% | 16.87% | 18.63% | 19.88% | 19.64% | 8.89% | 5.49% | 9.81% | -1.57% | 11.17% | 6.97% |
| 2008 | -10.46% | -21.09% | -27.68% | -33.85% | -37.10% | -31.93% | -37.00% | -40.54% | -33.79% | -45.09% | 5.24% |
| 2009 | 17.76% | 23.37% | 28.39% | 33.42% | 38.06% | 22.68% | 26.46% | 43.89% | 27.17% | 27.75% | 5.93% |
| 2010 | 10.31% | 13.15% | 14.29% | 16.45% | 17.71% | 14.06% | 15.06% | 16.91% | 26.86% | 4.90% | 6.54% |
| 2011 | 2.19% | 1.70% | -0.95% | -2.62% | -3.94% | 8.38% | 2.11% | -1.80% | -4.18% | -12.14% | 7.84% |
| 2012 | 8.47% | 11.33% | 13.79% | 15.90% | 17.42% | 10.24% | 16.00% | 15.91% | 16.35% | 17.32% | 4.22% |
| 2013 | 7.65% | 16.71% | 22.51% | 27.50% | 32.22% | 29.65% | 32.39% | 38.32% | 38.82% | 29.65% | -2.02% |
| 2014 | 2.52% | 2.99% | 3.53% | 3.41% | 3.68% | 10.04% | 13.69% | 13.40% | 4.89% | -4.90% | 5.97% |
| 2015 | -0.35% | -1.74% | -1.77% | -2.24% | -1.86% | 0.21% | 1.38% | 5.73% | -4.41% | -0.81% | 0.55% |
| 2016 | 4.31% | 5.70% | 5.35% | 5.40% | 4.74% | 3.44% | 11.96% | 7.50% | 21.31% | 1.00% | 2.33% |
| The Month of January '17 | 1.02% | 1.38% | 2.08% | 2.57% | 3.05% | 0.62% | 1.90% | 4.30% | 0.39% | 2.90% | 0.23% |
| Year-to-date (31 Dec '16 to 31 January '17) | 1.02% | 1.38% | 2.08% | 2.57% | 3.05% | 0.62% | 1.90% | 4.30% | 0.39% | 2.90% | 0.23% |
| Last 12 Months | 6.19% | 9.94% | 12.84% | 15.67% | 17.64% | 23.89% | 20.04% | 21.69% | 33.53% | 12.03% | -0.85% |
| Last 3 Years Annualized Average | 2.63% | 3.22% | 3.62% | 3.80% | 3.78% | 10.88% | 10.85% | 11.01% | 7.89% | 0.71% | 1.91% |
| Last 5 Years Annualized Average | 4.20% | 6.32% | 7.75% | 8.77% | 9.76% | 12.28% | 14.09% | 14.82% | 13.00% | 6.04% | 1.17% |
| Last 10 Years Annualized Average | 5.13% | 5.94% | 6.25% | 6.45% | 6.82% | 7.43% | 6.99% | 8.59% | 6.93% | 0.97% | 4.01% |
| Last 15 Years Annualized Average | 6.91% | 7.87% | 8.17% | 8.20% | 7.97% | 7.39% | 6.93% | 7.36% | 8.59% | 5.87% | 4.16% |
| Annual Average Since Inception (31 Dec '98 - monthly compounding) | 7.59% | 8.40% | 8.68% | 9.07% | 9.35% | 6.83% | 5.45% | 5.34% | 8.12% | 3.64% | 4.43% |
| Conservative Model | Moderately Conservative Model | Moderate Model | Moderately Aggressive Model | Aggressive Model | DJIA | S&P 500 | NASDAQ | Russell 2000 | MSCI EAFE | Barclays & S&P US Aggregate Bond |
|
More About Robo-Advisers The long-term failure with Robos will be caused by the short-term success of their one and only asset-gathering magic trick - rock-bottom fees. This is all they have - the fintech that automatically invests your money via a cookie-cutter asset allocation mix. One person (like me) gave their Models to a coder, and they made it so when money hits the account, the algorithm automatically invests into a Model Portfolio. Because the money manager doesn't have to manually care for the money, they only have to do the work once, instead of several times a day. This is how they lower their expenses and seem to make everything magically happen "for free." There's too many problems to list with this - are they swapping old vehicles for new ones efficiently? Are they any good at that? Are they rebalancing, when, what are their triggers and ranges, and at what level? Are they any good at that? How are they maintaining the asset class weights, and are they using market timing to do that? Are they any good at that? Are they using both mutual funds and ETFs - which are now required to be competitive (using both all mutual funds or all ETFs is a recipe for sub-par investment performance)? Are they any good at that? Do they know when to use a fund or an ETF? Are they any good at that? Are they adequately maintaining their compliance and legal requirements? Are they any good at that? That's very expensive, so probably not. So it's just a matter of time before all of those chickens come home to roost. The answers will be in their returns, which so far, are just similar to our Index Fund Models, which are bad when compared to our actively managed Model Allocations. You get what you pay for, and know it or not, you're paying for good returns while getting adequate risk reduction via diversification, no market timing, and good vehicle selection and allocations. That can only be so good for so long when the people doing the high-value work are being paid "rock bottom-Robo wages." Then it's not just people at the Robo firm being underpaid - their business models dictates that everyone involved in the process work in the "race to the bottom" rock-bottom-low-pricing world. So it's only a matter of time before their relationship with their vendors breaks too, because eventually, they're going to wake up and want to be paid enough money to survive too. The deal with enticing investors with uber-low fees, is that the very few people with brain cells working there haven't been paid, are not getting paid now, and they won't be getting reasonably paid in the future - ever. So sure, it may look spiffy and seem like a good deal now, but eventually, the money manager(s) maintaining the asset allocations will get a grip on the reality that their paycheck will always be a small fraction of what they can earn just about anywhere else, and/or by starting their own firm, and they'll quit. Then they'll be replaced by lesser and lesser qualified money managers every time this happens. Then most Robos offer no control, and some think that's good by making their program not allow you to sell when the market goes down. Only they know if it will prevent you from buying when the market goes up too. A few market downturns ago (probably Brexit), Betterment wouldn't allow you to sell anything at all until they felt the irrational panic was over. While typing about Betterment - we were sort of involved in the whole process in 2015, when Tony Robbins was deciding which way to go with the Robo thing. He considered us, according to our middleman. So I did the math on that. Everything seemed like it was a good deal for him (Tony), the other owners, low-level employees, and investors. But when I took expected gross income, minus expenses (including the low-level employees), to get net income - and then divided that by the number of high-value employees, it turned out that they're making about $100,000 a year. The point is that's about one quarter of what someone at that level could make if they got a job on Wall Street, and/or started their own firm. So the bottom line is it's only a matter of time before the people that perform the most important functions at Betterment realize the honeymoon is over, they wake up, and quit for more compensation. Another point is this is the exact same situation that all Robos Advisers are in. So look for changes there in a few years (in the form of much higher AUM fees). End of the Betterment digression. This is sort of the same as hiring a normal money manager with full discretion (which means they can do whatever they want with your money anytime they want, without telling you, but within boundaries), but there you can always tell them what to do, and they do it (and/or what to not do). Robos will just tell you no, give you no control, and then if their magic algorithm makes a market timing mistake, then a bazillion times more money could be lost than you've saved in fees. Also, just wait for their algorithm to fail, just like all code does, and make millions of erroneous trades (which cannot be undone). Or they get hacked and load up on pork bellies just for fun. Without paying humans good money to constantly keep an eye on things, anything and everything can and will eventually go wrong. That was the first and most important thing the old portfolio manager told me as I was replacing him in 1998 - you always have to check, double-check, and triple-check everyone's work every time, or there will be a very expensive, time-consuming, and unfixable failure). So when your minimal staff is minimally compensated (to keep the fees rock-bottom), that opens the door to too many potential failures to type about here. If I was the head of the SEC, I'd put a blanket ban on all forms of Robos, just for this reason alone. One of the most probable things the SEC will do is make them add human staff until the point is reached where they feel Robos are safe. The point is, hiring all of those people will make their fees go up, which will make the high-value people quit because of the added annoyances combined with the fact that if they are any good, then they could be making five to tens times more down the street. This will lower returns, increase risk, and make them much less competetive compared to human money managers. When the free lunch starts to taste not so good, then they will go away. So eventually, each one will self-implode with neglect, mistakes, failures, then the regulators will add uber-expenses to their deals (if they don't just kill off the whole deal entirely, which is what some say they want) - and all of this will show in their after-expense returns. Then investors will start to bail when they see there really is no free lunch and you get what you pay for. They have have realized a bargain for a few years, but then their after-fee returns will be less than hiring a Real World asset manager, and they'll return to them en mass. So in a few years, Robo investors will flee en mass, and return to what works best for everyone long-term - DIY or hiring actual hands-on money managers. Especially when the SEC gets through with them, making them spend BIG money staying compliant - thus raising their expenses, and then their fees will go back up to levels where it makes no sense anymore - because their one and only magic trick will be gone forever. If the government doesn't change, kill off, or make the whole business model not work for another long list of reasons over the next year or so. Articles About Robos and the Upcoming SEC Clampdown These Investor Models, and the Comprehensive Asset Allocation Software, are two different programs, with different pricing tables. So the most frequently asked question is..."What's the Difference Between the Asset Allocation Software and these Asset Allocation Models?" With the asset allocation software, unlike allocation models which exist before someone is around to invest in them, the investor submits various life factors needed to calculate a custom allocation mix that reflects their life situation. So it's not just using one of a few generic pre-existing model allocations (there's dozens of asset class mix combinations). Model portfolios only take one life factor into account - investment risk tolerance category. This is determined by filling out and scoring an investment fact finder. There's little-to-no "work" involved. You'd just determine risk tolerance, allocate money according to the model's asset class weights, and then make the trades. The comprehensive asset allocation calculator also takes risk tolerance into account as the most important factor in determining the mix, but it also uses a few more life factors. With the asset allocation calculator, the currently-held investment mix is then compared to the recommended mix of asset classes. Then investments are shuffled around to create the proposed mix (the new investment recommendations, AKA proposed snapshot). It then displays current and proposed snapshots that can be analyzed and compared. Then future projections can be made given various assumptions. This allows complete control over most every aspect of the asset allocation process. Model portfolios only show investment recommendations (the proposed snapshot), and mostly ignores the currently-held investment portfolio. So with the comprehensive asset allocation software, there's work involved in creating an investment portfolio that's custom tailored to fit the investor's life. This makes it best suited for larger clients that are paying an advisor enough to make it worth doing the extra work (or doing it yourself). Our regular portfolio models only use 17 asset classes, and the asset allocation calculator accommodates an unlimited amount (we screen mutual fund asset classes for 22). The models have less asset classes to minimize the amount of money needed to buy everything. It's currently around $100k to buy the Fee-Based Moderate Model (less for the other four allocations because they don't use every asset class (plus there's also $60k and $20k models for that). You don't subscribe to the allocation software, because it doesn't change monthly. You'd only subscribe to the mutual fund selections to keep the funding vehicles current. It's best to subscribe to the models to keep portfolios updated with both fresh funding vehicles and allocation changes. For DIY investors, the choice of using the investing models or the asset allocation software shouldn't be governed by how much money you have. It just should depend on how much time and work you're willing to put into matching your portfolio(s) to your life. Using the portfolio models is fast, easy, and simple. Once you know your risk tolerance category, everything is done except making the trades. The asset allocation calculator is complex and will take an extra hour to create your investment portfolio, but it will match your life better. How to get around BD compliance if they don't approve of our money management systems |
Buy now with your Visa or MasterCard by calling (707) 996-9664
Disclaimer: This financial plan software is designed to allow financial planners, investment managers, other financial services professionals, and investors, to demonstrate and evaluate various financial strategies in order to help achieve their clients', or their own financial goals. Investment strategies, results and any other information presented on the website are for education and research purpose only. There are no guarantees that any of the software will perform this function. The investment choices and services on this site are provided as general information only, and are not intended to provide investment, tax, legal, financial planning, or other advice. This site is for information purposes only and does not constitute an offer to sell or a solicitation of an offer to buy any security, which may be referred herein. Mutual fund recommendations made are suggestions only, and customers should evaluate the suitability of each fund for their own holdings on their own or seek professional advice. They are generic in nature and do not take into account your detailed and complete personal financial facts and needs. You alone are responsible for evaluating the information provided and to decide which securities and strategies are suitable for your own financial risk profile and expectations. Consult with your financial, legal, or tax advisor with regard to your individual situation. Toolsformoney.com is not engaged in rendering legal, accounting, tax, or other professional advice. In no event shall Toolsformoney.com be liable to customers for any damages whatsoever, including lost profits or savings, missed gains, or other incidental or consequential damages arising out of the use, or inability to use, any of the software or information obtained from this website. Financial estimates are generated by using many assumptions made by the program, clients, advisors, and the user. No person or software program can predict the future with any degree of certainty. No warranty as to correctness is given and no liability is accepted for any error, or omission, or any loss which may arise from relying upon data generated from reports produced by these programs. Toolsformoney.com makes no warranty of any kind regarding our site and/or any contents, strategies, portfolios, materials, information, products and services provided on our site, all of which are provided on an "as is" basis. We disclaim any representation and warranty that our site and its contents, strategies, portfolios, materials, information, products and services are error-free, secure or uninterrupted. We further disclaim any warranty to the accuracy, completeness and timeliness of any content, information and services provided by our site. In no event shall Toolsformoney.com be liable to you or any other party, for any special, consequential or incidental damages suffered by you or such other party as a result of any problems that may arise because of the installation or improper use of this software or presentation of reports produced by this software. All reports generated by this financial planning software are only rough estimates of many possible future scenarios (none of which will occur in the Real World). Furthermore, in no event shall Toolsformoney.com be liable for any damages or injury caused by any failure of performance, error, omission, interruption, deletion, defect, delay in operation or transmission, computer virus, communication line failure, theft or destruction or unauthorized access to, alteration of, or use of record, whether for breach of contract, tortuous behavior, negligence, or under any other cause of action. Before investing in an ETF or mutual fund, carefully consider the investing objectives, risks, charges and expenses. For a prospectus containing this and other important information, contact the mutual fund / ETF and read the prospectus carefully before investing. The website is not operated by a broker, a dealer, a Broker Dealer. Information provided by the website could be time-sensitive and out of date. There is no guarantee for accuracy and completeness for the contents on the website. Contents are subject to change without notice. There is no guarantee for future results in your investment and any other actions based on the information provided on the website including but not limited strategies, portfolios, articles, performance data and results of any tools.
© Copyright 1997 - 2018 Tools For Money, All Rights Reserved